

average assets switzerland median assets income switzerland

Median & average wealth Switzerland

It is said everywhere that Switzerland is so rich. But what does it actually look like in detail - and is it still true?

💰 Swiss wealth – at a glance
Median assets
CHF 115,000
per adult
average
CHF 721,000
per adult
Rank Median
8th place
worldwide
Rank Average
🥇 First place
worldwide
📊 Source: UBS Global Wealth Report 2026 (June 2026), data for 2025. Broad definition of wealth including pension funds, Pillar 3a and property at market value.
🧮 Our wealth calculator below uses a different basis for its calculations: Swiss tax data from the FTA, excluding pension funds and Pillar 3a. We explain in the article why this results in a completely different figure.

In this paper, we want to look at how high, for example. Average savings throughout Switzerland are. When looking at the average assets in Switzerland, you should distinguish between the Median assets and the Average assets. Since your school days may have been a while ago, you'll know the difference and be able to shine in the next discussion.

Read on to find out if you're already part of the wealthy 50 percent and how you can build your (median) wealth quickly and efficiently with a few simple tips.

Table of contents

Average wealth Switzerland by age

Looking at average wealth across Switzerland makes only limited sense. The Median assets Switzerland-wide is much more meaningful, as you will learn below.

Is there a median wealth figure for Switzerland broken down by age?

No, at least not at national level. The Federal Statistical Office does not conduct its own wealth survey and, on its wealth page, simply displays the table provided by the Federal Tax Administration. The FTA, in turn, receives only categorised data from the cantons, without any age details, and expressly excludes analyses by age group. There is therefore no official, nationwide table showing wealth by age.

The best available indication is provided by LUSTAT Statistics Lucerne. The analysis is based on real tax data and shows how wealth is built up over the course of a lifetime:

Age of the reference person Median equivalent net wealth, Canton of Lucerne 2020
18 to 25 yearsCHF 15,800
26 to 34 years oldCHF 26,000
35 to 44 years oldCHF 26,900
45 to 54 years oldCHF 49,700
55 to 64 yearsCHF 104,600
65 to 74 yearsCHF 240,700

Source: LUSTAT Lucerne Statistics, FinSit 2024, data for 2020. Across all age groups, the figure stood at CHF 69,900.

Important to bear in mind: These are not Swiss average figures. The figures relate to private households in the canton of Lucerne and show the median equivalent net wealth by age of the reference person. They provide an indication of how wealth grows over the course of a lifetime, not the exact amount of wealth you should have at your age. As with tax statistics, pension funds and Pillar 3a savings are not included here, and property values are shown at their tax value rather than their market value.

Two things stand out about this series. The A leap in retirement age An increase from CHF 104,600 to CHF 240,700 is not a sudden windfall, but rather a reclassification: on retirement, pension fund assets are withdrawn and Pillar 3a accounts are closed. This money was already there, but did not appear in the tax statistics. It does so from the moment it is paid out.

And the Delle between 35 and 44: This group has seen its income rise by just 9.1 per cent since 2010 – less than any other. LUSTAT attributes this to reduced working hours following the arrival of children and to higher expenditure, such as on external childcare. Those who make little progress financially during this phase are therefore not the exception, but the rule.


Median Wealth Switzerland Calculator: How do you compare?

First things first: the box at the top shows a median net worth of CHF 115,000, whilst this calculator gives a figure of around CHF 40,000. Both figures are correct; they simply measure different things. The calculator uses tax data from the FTA, which does not include either pension funds or Pillar 3a savings. We’ll explain why this makes such a big difference straight away.

Computer is loading...

How much money should you have saved by 30?

If you want to know how much you should have saved by your age, you can check with your Age group compare. However, bear in mind that everyone has different circumstances and that wealth accumulation goals are always individual. So don't let the overview (average wealth in Switzerland by age) worry you.

As explained above, there is no Switzerland-wide figure for 30-year-olds. In the canton of Lucerne, the median equivalent net wealth for the 26 to 34 age group was CHF 26,000. What the calculator can tell you precisely, however, is where you stand in the nationwide distribution with a specific amount.

Keep in mind, however, that the "Average wealth of Swiss 30 year olds" can also look drastically different in some cases. Average assets to compare across Switzerland or Average savings throughout Switzerland makes only limited sense for the following reasons.

How much wealth do you need to be considered rich in Switzerland?

There is no official threshold. According to our model, which is based on the FTA’s distribution data, the top decile begins at around CHF 760,000 in reported net assets, and the top one per cent at around CHF 4.8 million. Both are modelled thresholds and not published figures, as the FTA does not publish percentiles.

Without making any modelling assumptions, the only figures that apply are those derived directly from the official case figures: around 85 per cent of taxpayers report less than CHF 500,000, around 93 per cent less than CHF 1 million. And around 22 per cent report no net assets at all.

Our financial tips for 2026

"Intelligent people learn from the mistakes of others".

We have compiled our top selection for you from all our tests and experience reports:

Difference between median and average wealth in Switzerland

You can work out the average wealth by dividing the total wealth of a given group by the number of people in that group. In the UBS Global Wealth Report, the calculations are based on each adult.

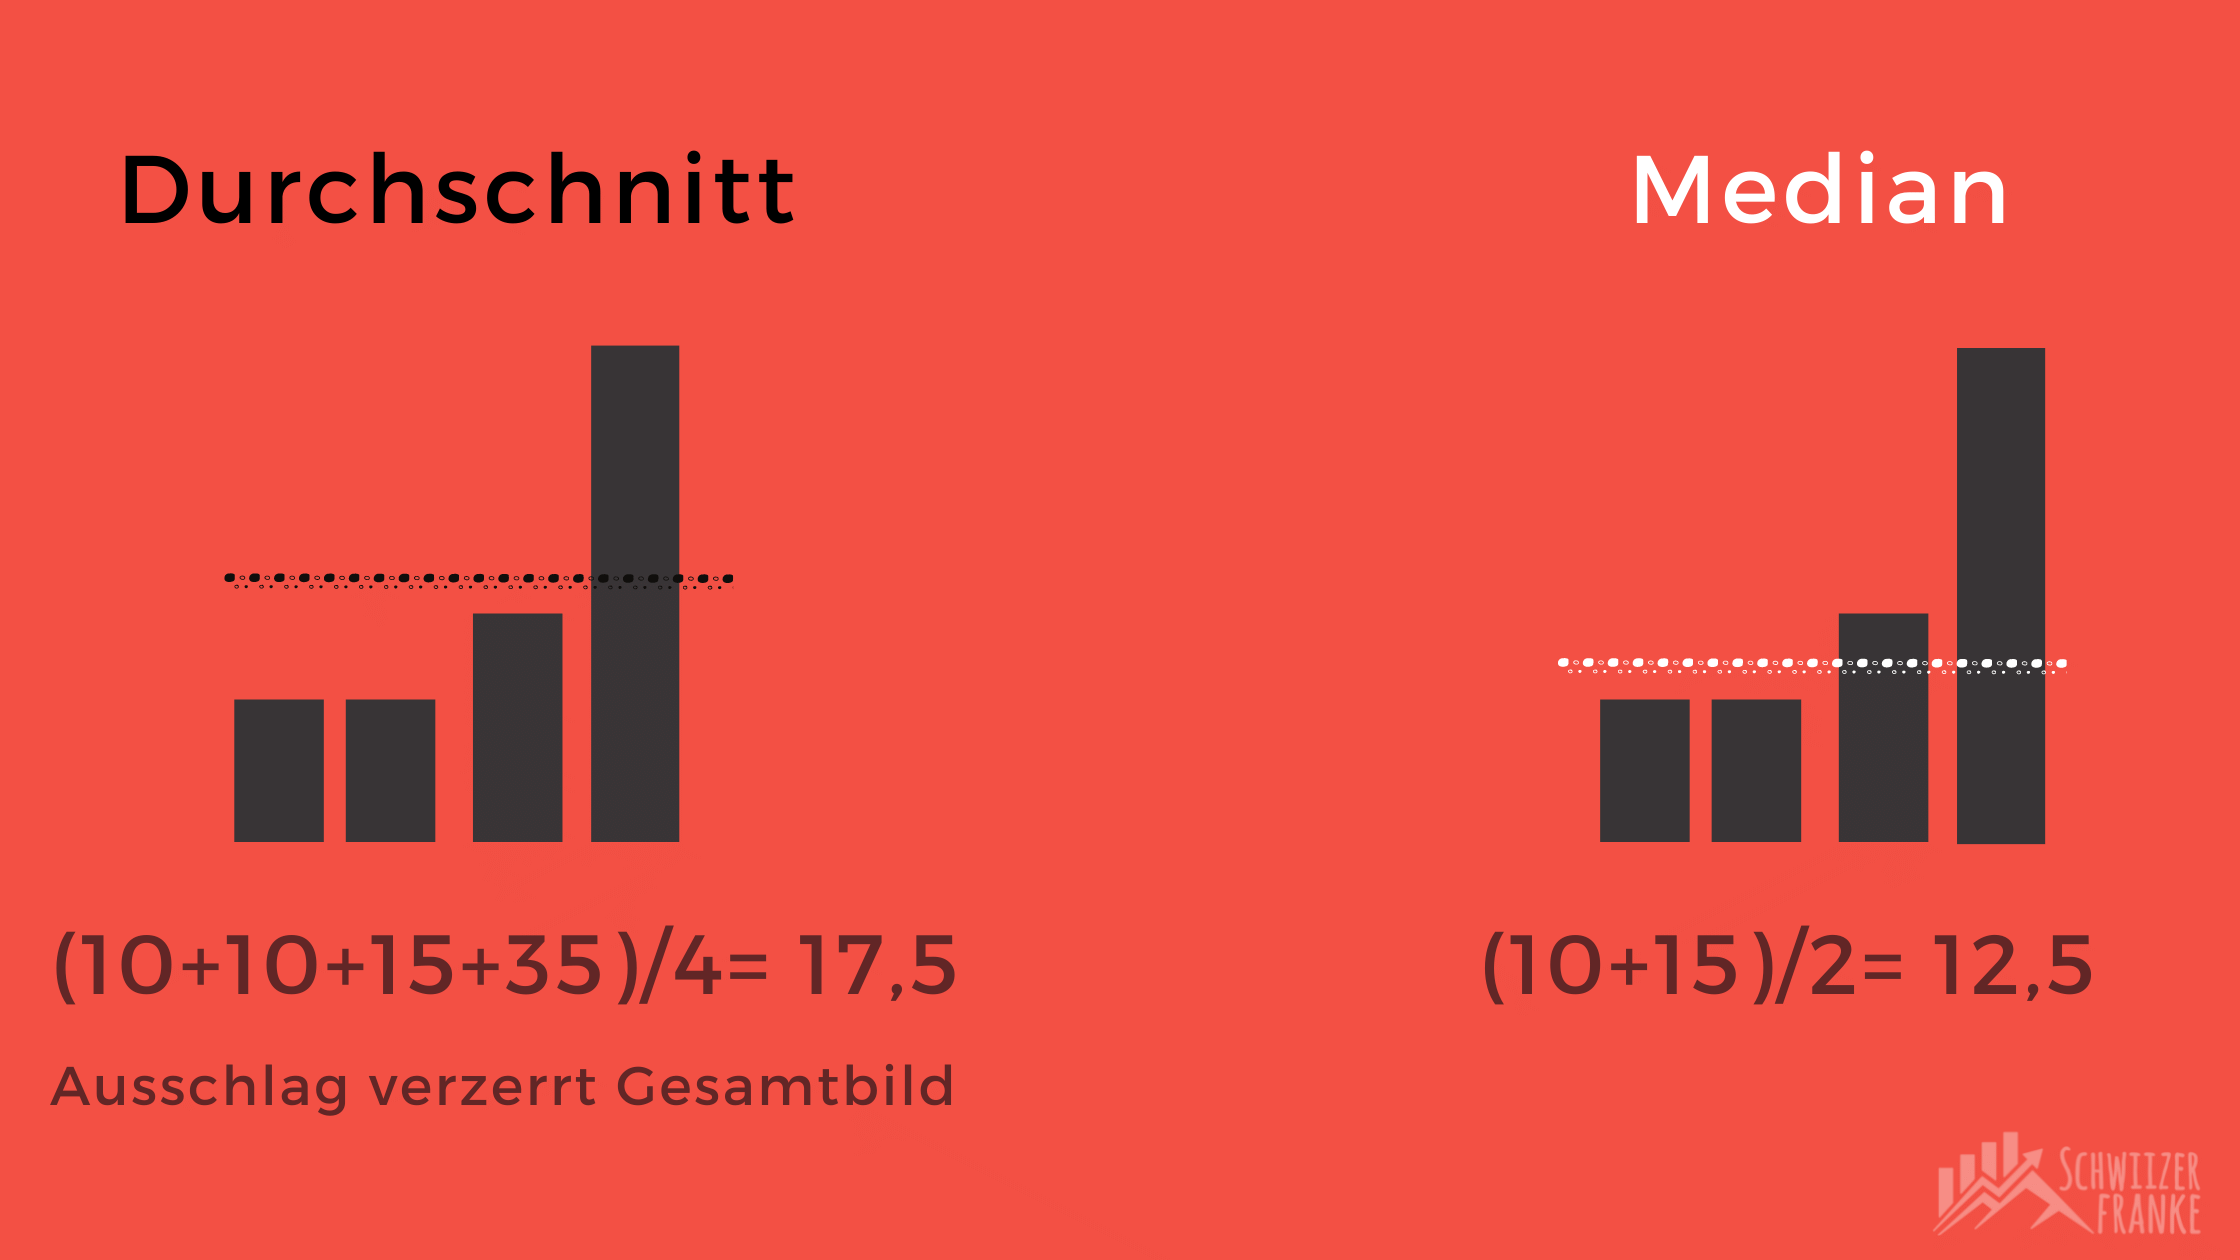
With median wealth, also called mean wealth, we include the distribution of wealth in a country, society or group.

In short, the median wealth represents the middle of the wealth distribution. Either you belong to the 50 percent who are above the median wealth or to the other 50 percent.

Median wealth Switzerland Average wealth income switzerland germany comparison

Why are there two different figures for the median wealth in Switzerland?

Anyone looking up the median wealth in Switzerland will find figures of either CHF 115,000 or around CHF 40,000, depending on the source. This is not a mistake, but the result of two completely different surveys.

UBS measures what people own. The Global Wealth Report estimates total wealth per adult based on national accounts. Pension funds and Pillar 3a savings are included, whilst property is valued at market value. This approach is suitable for international comparisons because the same metrics are used in every country. For Switzerland, however, the report does not publish a sufficiently detailed breakdown to allow a specific wealth figure to be assigned to a particular percentile.

The FTA measures what is subject to tax. The Swiss National Statistics on Taxable Assets is a comprehensive survey covering 5,188,619 taxpayers subject to unlimited tax liability. It records net assets, i.e. assets minus liabilities. Pension funds and Pillar 3a are entirely excluded, as they are not subject to wealth tax. Property is valued at its cantonal tax value, which is significantly below market value. However, it is known how these assets are distributed across eleven categories.

Why the gap is so wide. Three factors are working in the same direction. The 2nd pillar pension capital is completely missing from the tax data. Property is valued significantly too low based on its tax value. And married couples are treated as a single taxable unit, whereas UBS calculates on a per-person basis. Taken together, this explains the factor of three.

What each number is used for. The UBS figure shows how wealthy Switzerland is by international standards. The FTA figure shows where you stand within Switzerland. For this question, we use the FTA’s tax statistics because they show the distribution of taxable net wealth by wealth bracket. This is precisely why our calculator is based on FTA data rather than the UBS figures.

A median from one context must never be applied to a distribution from another. We therefore consistently refer to the FTA figure as the «modelled median of recorded net wealth» and reserve the term «median wealth in Switzerland» for the UBS figure.

This is how rich we Swiss really are

First of all, we can give ourselves a pat on the back. According to figures from the UBS Global Wealth Report 2026, we Swiss continue to lead the way when it comes to average per capita wealth. We rank right at the top in terms of average wealth – it seems we’re doing a lot of things right.

It is interesting to see the clear difference between the average and median wealth in Switzerland. Did you know that the average wealth is a proud CHF 721,000 while the median asset CHF 115,000 is?

This means that the average wealth is strongly influenced by some extremely high assets. In contrast, the median, where one half of the population owns more and the other half less, gives a more realistic picture of the distribution of wealth in Switzerland.

Tax statistics show just how high the level of concentration is: The FTA estimates that the wealthiest 1 per cent account for 45.8 per cent of total recorded net wealth for 2022. One hundredth of taxpayers therefore hold almost half of the total. This proportion is calculated on the basis of the eleven published wealth brackets, assuming a Pareto distribution. It is an estimate rather than an exact figure, but it comes from the tax authority itself.

Surprising: In terms of median wealth, Switzerland now ranks only 8th place worldwide. Luxembourg, Belgium, Australia, New Zealand, Denmark, Hong Kong and Canada have a higher average per capita wealth.

A counter-example is Germany. In terms of average wealth, Germany stands at around CHF 275,000 in 14th place. The median wealth is around CHF 42,000, which means 30th place – the bottom of the rankings published by UBS.

The situation is similar in Austria, with an average of around CHF 222,000 and a median of around CHF 57,000, putting it in 27th place. The gap is even wider in the USA: 2nd place in terms of average wealth, with around CHF 552,000, but only 28th place in the Median rankings with around CHF 55,000.

What is Switzerland’s total wealth?

There are two answers to this question, because two institutions are measuring two different things.

The Tax data from the FTA For 2022, this amounts to CHF 2,289 billion in recorded net assets, distributed amongst 5,188,619 taxpayers subject to unlimited tax liability.

The National Bank In its financial accounts, net household wealth is put at CHF 5,132 billion at the end of 2025, an increase of CHF 226 billion compared with the previous year.

The discrepancy is not a contradiction, but a matter of definition. The SNB includes property at a market value of CHF 2,924 billion and occupational pension entitlements in its calculations. Both are completely absent from the tax data. The SNB figure, however, does not show how this wealth is distributed. We therefore use the FTA’s tax statistics to analyse the distribution of net wealth recorded for tax purposes.

Wealth by country, UBS Global Wealth Report 2026
🇱🇺 Luxembourg CHF 519,000 CHF 312,000 1st place
🇧🇪 Belgium CHF 323,000 CHF 220,000 2nd place
🇦🇺 Australia CHF 488,000 CHF 167,000 3rd place
🇩🇰 Denmark CHF 415,000 CHF 161,000 5th place
🇨🇦 Canada CHF 317,000 CHF 117,000 7th place
🇨🇭 Switzerland CHF 721,000 CHF 115,000 8th place
🇳🇱 Netherlands CHF 329,000 CHF 101,000 12th place
🇦🇹 Austria CHF 222,000 CHF 57,000 27th place
🇺🇸 USA CHF 552,000 CHF 55,000 28th place
🇩🇪 Germany £275,000 CHF 42,000 30th place

Columns: Average wealth, median wealth, global ranking relative to the median. The Median rank shows the exact rank of a country in terms of the wealth of the person in the middle. A comparison with the average shows how a country’s performance varies internationally depending on the indicator. Source: UBS Global Wealth Report 2026, data for 2025, converted at the FTA year-end exchange rate of CHF 0.792250 per USD.

Top recommendations for 2026

Your key to success! Discover our top recommendations from real testimonials.

4 Simple Tips to Build Your Median Wealth Fast

Enough of statistics and we certainly shouldn't rest on our laurels. Because 50% of the Swiss - i.e. every second person - has less than the median wealth. If you are one of them, you can use the following tips to build your wealth quickly.

1. reduce subscription costs

A golden rule for good investors is not to match expenses to income and always live in the same ratio. The goal should be to minimize your expenses. Because the calculation is very simple: If more money stays in the pot, you can build up a fortune faster.

Here we show you how to optimize your cell phone, Netflix and subscription costs.

2. applying the 3 accounts model

An absolute no-brainer is the 3 account model. The special thing about it is that you only have to take care of it once and set everything up. Afterwards, everything happens completely automatically and you will have saved a lot of money after a short time. 

The implementation is simple and you need three bank accounts - three sub-accounts at your house bank will do. You set up a salary, fun and investment account and optimize your cash flow. No additional income is necessary! Here we have summarized the whole process in 5 stepst and taken up visually.

3. save taxes

Taxes represent a large item in your expenditure balance sheet. By making targeted optimisations and small adjustments, you can minimise these expenses and thus save on taxes. At the same time, you will have more money left over to build up your assets even faster and avoid debt. We have summarised the most important tips for saving taxes below.

4. Invest in your knowledge

Investing in your own skills is the best investment you can ever make. As you continually expand and internalize your knowledge, your financial IQ increases while lowering your investment risk. We have a collection for you of the best books on the subject of financial educationt. Take a look!

Or dive straight into the subject and secure your place in the next financial timetable.

Our financial tips for 2026

"Intelligent people learn from the mistakes of others".

We have compiled our top selection for you from all our tests and experience reports:

Conclusion on average wealth in Switzerland

We Swiss are the world leaders in average per capita wealth. Nevertheless, the statistics clearly show that only very few people have a Average assets of CHF 721,000 achieve. This becomes even clearer from the tax data: there, the modelled median of recorded net wealth stands at around CHF 40,000.

In short: The UBS figure is useful for international comparisons. If you want to know where your net assets, as recorded for tax purposes, stand within Switzerland, the FTA data provide a better basis. This fact has once again made it clear to us at Schwiizerfranke.com that financial education plays an important role.

How did you like our article on average wealth in Switzerland? Do you have a topic you'd like us to address in the future? Feel free to leave us a comment

Data sources (as at September 2026):
  • Wealth Statistics for Switzerland: The authoritative statistics on wealth in Switzerland are provided by the Federal Tax Administration, Nationwide statistics on taxable assets, tax year 2022, published in November 2025. It forms the basis for the calculator and the breakdown on this page.
  • Wealth by age: LUSTAT Lucerne Statistics, FinSit 2024, data for 2020, Canton of Lucerne.
  • Total household assets: Swiss National Bank, Financing Account 2025, published in April 2026.
  • International comparison: UBS Global Wealth Report 2026, data year 2025. Conversion from USD to CHF using the FTA year-end exchange rate of CHF 0.792250 as at 31 December 2025.
  • Calculation methodology: Interpolation within the published FTA classes, calibrated to the published class mean values. The open top class is modelled as a Pareto distribution.
  • Please feel free to use this: You are permitted to reuse our calculations and the modelled thresholds. We make our calculation methodology for wealth distribution and the modelled thresholds derived from it available, insofar as we hold the relevant rights, under CC BY 4.0 available. Please cite «Schwiizerfranke.com, own calculation based on the FTA’s 2022 wealth tax statistics», provide a link to this page and indicate any changes. The underlying data and content from the FTA, LUSTAT, the SNB and UBS are not covered by this licence and are subject to the terms and conditions of the respective publishers.

FAQ

There is no official Swiss-wide figure for 25-year-olds, as the FTA’s wealth statistics do not include a breakdown by age. In the canton of Lucerne, the median equivalent net worth for the 18 to 25 age group stood at CHF 15,800 in 2020. The calculator above will show you where you stand in the nationwide distribution based on a specific amount.

There is no official figure for 30-year-olds across Switzerland. In the canton of Lucerne, the median equivalent net wealth for the 26 to 34 age group stood at CHF 26,000 in 2020. To put this into perspective: around 22 per cent of all taxpayers in Switzerland have no recorded net wealth at all.

There is no figure for Switzerland as a whole. In the canton of Lucerne, the median equivalent net wealth for the 45 to 54 age group stood at CHF 49,700 in 2020, whilst for the 55 to 64 age group it was already CHF 104,600. The period between the ages of 45 and 65 sees the greatest accumulation of wealth during a person’s working life. These figures do not include pension funds or Pillar 3a savings.

The median wealth at the age of 50 is CHF 124,000, which includes all assets (bank accounts, securities, real estate, pillar 3a) less debts, but excludes pension fund assets.

In the canton of Lucerne, the median equivalent net wealth of households with a reference person aged between 65 and 74 stood at CHF 240,700 in 2020, the highest figure of all age groups. However, the sharp increase compared with the 55 to 64 age group, at CHF 104,600, is misleading: it is largely due to pension fund assets being withdrawn and 3a accounts being closed upon retirement. This capital was already in place but did not appear in the tax statistics.

According to tax data from the FTA, the modelled median of recorded net assets stands at around CHF 40,000. Around 22 per cent of taxpayers have no recorded net assets at all, whilst around 53 per cent have less than CHF 50,000. Pure bank balances account for only part of this; these figures also include securities and property at their tax value. Pension funds and Pillar 3a savings are not included.

There is no such figure available for Switzerland as a whole. The FTA receives only categorised data from the cantons, without any age details, and expressly excludes analyses by age group. The only citable age-specific data series for Switzerland comes from LUSTAT Lucerne and applies to a single canton. You can find the figures in the table above.

27 responses
  1. «Because there are still enough Swiss people who belong to the bottom 50 per cent of the median wealth. »

    Yes, and strangely enough, it is always exactly 50% that belong to the lower 50%, no matter how high the assets are.....

    1. Touché! Someone was paying attention in maths class 😄 You're right, of course - the median is always exactly 50% by definition. Thanks for pointing that out!

  2. In principle, I always find such articles quite interesting, but when it says «We are in first place for both median and average wealth», but then in the corresponding table 6 out of 10 countries are ahead of Switzerland for the median, the question inevitably arises as to whether all the other information is also just total rubbish.

    1. The table was (as declared) from 2021 and accordingly the 1st place was still correct here. The source (Wikipedia) is still set to 2021 for the Gini... But because this is confusing, we have now switched to other data. So your feedback has helped 🙂

  3. How up-to-date is the data? I haven't found that anywhere. If Credit Suisse figures are quoted, it must be some time ago. it's the end of October 2025.

      1. Update, 9 September 2026: The article now draws directly on data from the Federal Tax Administration for the 2022 tax year, published in November 2025. The FSO displays the same FTA table on its wealth page.

  4. Thank you for the article.
    Is the data above from the Federal Office on assets at household level or individual level?
    Greetings

      1. Addendum, 9 September 2026: The FTA data covers taxable entities, with married couples assessed jointly counted as a single entity. The UBS Global Wealth Report, by contrast, calculates the figures per adult.

  5. Hello, I have just discovered this compilation. Good overview. I will recommend this page to my children (aged around 30). What I'm missing from the list of assets is property ownership. The assets are zero if the mortgages are high enough. In my experience, home ownership, including property for rent, is still a very good investment.

    And what I'm still missing: the income and asset situation of pensioners is not included. I wish that these figures would also appear here.
    And the financial tips for this age group would also be important. Many people over the age of 65 continue to work and try various ways to improve their financial situation.
    I would be delighted if these aspects were included here in the coming weeks and months.
    Merci already now 🙂

    1. Thank you for your feedback, Lilo! 🙂
      These are very good suggestions, which I am happy to take on board. Reliable data is always important - if I find something suitable, I'll be happy to include it in the article!

  6. Hello Eric
    How did the statistics come up with a difference of 50%: "According to the statistics, our average (USD 696,604) and median wealth (CHF 168,084) are only around 50 per cent apart."? ?

  7. Hello Eric. Please note that your calculator says "Assets according to tax return". However, 3a funds are not declared as assets in the tax return. In the chart above regarding median salary, however, you write that 3a funds are included. What is correct?

  8. Great overview and work, Eric. Many thanks for that.
    In my personal assets, I always include the PF assets according to the latest statement of the pension fund, AFTER taxes. I also consider the assets in the pension fund to be "safe" because many regulations apply that force the pension funds to invest conservatively. Large fluctuations should not happen. Instead, I can invest the money that remains after I have put aside the nest egg in a somewhat riskier way.

    1. Hello Martin,
      that's a good approach, thanks for sharing!
      Personally, I also track this for myself in Portfolio Performance and have created a category there "tied pension provision" -> so I always know which part of my assets I can access and which I can't or only to a limited extent.
      Best regards 🙂

      1. The assets are constantly compared without PK and 3A. However, this makes little sense.

        There are people who buy heavily into the pension scheme. Or there are countries that have hardly any pension provision.

        If this were taken into account, Switzerland would probably be in a better position on the one hand. On the other hand, the differences in wealth in Switzerland would be much greater...

        1. You are right that pension fund and 3a assets are not included in most international comparisons. This would indeed put Switzerland in an even better position. However, this applies equally to all countries - pension entitlements from pay-as-you-go systems (e.g. in Germany) are also missing from the statistics. The comparison is therefore consistent, even if it does not show the full picture.

  9. Which assets are included in assets (in Switzerland)? Specifically: Incl. or excl. pension fund assets (2nd pillar)?

      1. Hmm... that of course "distorts" the matter of assets relatively strongly, at least in comparison to countries where old-age provision is largely in the "1st pillar" (state pension provision according to the pay-as-you-go system)... I assume that's why (not only) things look quite different in Germany.

        1. Correct, in other countries the pension systems are generally structured differently - but they are probably considered equally in such analyses. Do you think that pension fund assets (or their equivalent abroad) should not be taken into account here?

          1. My assumption/opinion: The credit balance of the 2nd pillar in Switzerland corresponds to the cash value of the expected pension (funded method). For a state pension, this amount is not visible or is not saved anywhere (pay-as-you-go method).
            The PF assets are somehow an in-between between free assets and potential pension in the future, since there are (currently) possibilities to transfer these funds early into the free assets (home ownership promotion, self-employment, leaving Switzerland). However, such a capital withdrawal lowers the future pension, so compared to other countries it would be something like a loan that you then pay off during retirement with lower pensions. Overall, the comparison across different systems is certainly very difficult. Therefore, it would be interesting from my point of view to see how the situation is with and without pension funds, so everyone could make a picture and judge.
            In addition, I find it problematic that the PF assets are still pre-tax, so to speak, and would only be taxed when transferred to free assets. At least this circumstance should be taken into account when comparing these assets with assets of people from other countries/systems. Whether the FSO takes this into account or not, I cannot judge. However, I tend to think not.

          2. am here absolutely with you Hugo! If you find reliable data where this is taken into account accordingly, feel free to forward it to me. I also keep my eyes open 🙂

        2. As a German who has lived in Switzerland for almost 11 years, perhaps I can help out. Yes, the German pension system is mainly based on a pay-as-you-go system like our AHV here. However, in Germany we also know the company pension plan (often in the form of a so-called Rürup pension), which is capital-based like our BVG (and so far at least does not suffer from hidden contributions as here), and with the Riester pension there is also a vehicle that is roughly comparable to the pillar 3a. However, I can't explain to you where the preference comes from to name screwed-up politically motivated pension innovations after people of dubious repute.
          The occupational pension scheme is usually available to higher earners, while anyone can take out a pension. However, within just a few years of their introduction, both systems have become worse and worse.

          My impression, which is also repeatedly supported by analyses and studies on the GINI coefficient, is that although we have a large spread in incomes in Switzerland, wealth is not quite as unequally distributed as, for example, in DE, AT or the USA.

Write a comment

Your e-mail address will not be published. Required fields are marked with * marked.

Investment Rageber Switzerland PDF investing beginner tips book ebook switzerland finances beginner

Make more out of your wages!

Free eBook: Learn how to build a second income step by step!