



Price to Earnings Ratio Calculator Calculate P/E ratio online with Online Price to Earnings Ratio Calculation

Price-to-earnings ratio (P/E ratio): Formula, calculator and the question of what constitutes a good P/E ratio

Nestlé is trading at a P/E ratio of around 17, Roche at 20 and Swiss Re at 10. Does that mean Swiss Re is the cheapest of the three? No. It means that the three operate in different sectors, and that the figure alone is meaningless.

The price-to-earnings ratio (P/E ratio) is the share price divided by earnings per share. That is all there is to the P/E ratio formula. It shows how many years’ earnings you are paying for a single share. Using the calculator below, you can calculate the P/E ratio and put it into context. You’ll then see what constitutes a good P/E ratio, where Swiss shares stand today, and where this metric might mislead you.

Table of contents

Price-to-Earnings Ratio – Key facts at a glance
FormulaP/E ratio = share price ÷ earnings per share
MeaningHow many years’ profits you pay for the share
Return on profitThe reciprocal of the P/E ratio: for a P/E ratio of 17, approximately 5.9 %
Coarse beltsBelow 10: good value or a problem · 10 to 20: normal · Above 25: growth factored in
SMI todayaround 19 to 20, historical average 15 to 16 (as at April 2026)
AttentionCompare only within a single sector; never across sectors
💡 Schwiizerfranke assessment: The P/E ratio is a price tag, not a verdict. A low P/E ratio could indicate a bargain or a company in trouble. Use it to narrow down your options, but never as the sole basis for a decision.

Calculate the price-earnings ratio

You need two numbers: the Share price and the Earnings per share (EPS, Earnings per Share).

P/E ratio = share price ÷ earnings per share

You can find the earnings per share in the annual report or on any financial page. If not, it is calculated by dividing the annual profit by the number of shares. A company with a profit of CHF 50 million and 20 million shares earns CHF 2.50 per share. If the share price is CHF 40, the P/E ratio is 16.

A real-life example: Nestlé is trading at CHF 77 in September 2026. The adjusted earnings per share for the last four quarters stand at around CHF 4.40. This results in a P/E ratio of around 17.5. In other words: you are paying 17.5 times the annual earnings for one Nestlé share.

What profit are you aiming for? That’s the most important question, and most guides skip over it. There are three options, and they yield three different P/E ratios:

  • Trailing (backwards): Profit for the last twelve months. A fact, but a thing of the past.
  • Forward: Earnings for the current or next financial year, as estimated by analysts. Listed on finanzen.ch as «P/E ratio 2026e». Up-to-date, but an estimate.
  • Adjusted: Profit excluding one-off items such as disposals, write-downs and legal costs. At Nestlé, this accounts for the difference between a P/E ratio of 17 (adjusted) and a P/E ratio of 22 (reported).

When you compare two P/E ratios, they must be calculated on the same basis. Otherwise, you’re comparing apples with oranges, and most forum discussions about «overpriced shares» are exactly that.
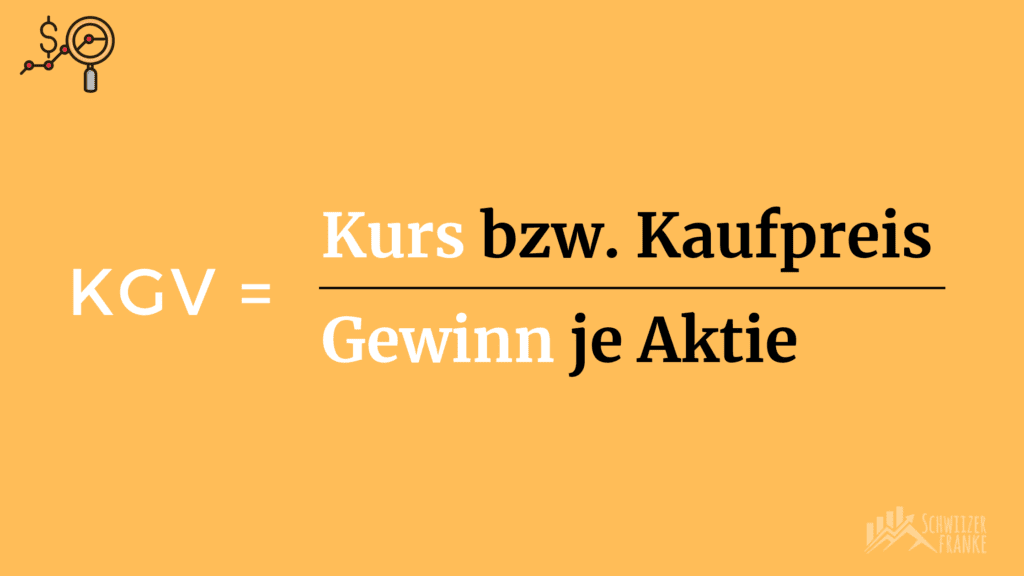

Price profit ratio formula PEG vs P/E formula price profit ratio online calculation P/E calculator

Course Gain Ratio Meaning and Classification

The P/E ratio tells you how many years it would take for the company to earn back your purchase price, assuming profits remain constant. A P/E ratio of 17 means 17 years. That is the simplest way to interpret it, and it is sufficient for most decisions.

The second metric is the return on investment, which is the reciprocal of the P/E ratio. 1 divided by 17 gives 5.9 %. This represents the profit the company generates per year on your investment, regardless of whether it distributes it or reinvests it. You can compare this figure directly with a bond or a savings account. A share with a P/E ratio of 30 has a profit yield of 3.3 %. Anyone comparing this with 1 % in a savings account will find it attractive. Anyone comparing it to 4 % on a safe bond will think twice.

That is why «expensive» or «cheap» always depends on the level of interest rates. When interest rates were at zero, a P/E ratio of 25 was normal. With 3 % interest rates, it is a price that assumes growth.

Top recommendations for 2026

Your key to success! Discover our top recommendations from real testimonials.

What is a good P/E ratio?

There is no such thing as a ‘good’ P/E ratio, only a ‘suitable’ one. A utility company with a P/E ratio of 25 is expensive, whilst a software company with a P/E ratio of 25 is cheap. The rule of thumb that is still useful, however, is:

  • Under 10: The market is anticipating falling profits, or the sector is cyclical (banks, insurers, commodities). This could be a buying opportunity or a warning sign – both are possible.
  • 10 to 20: Normal range for established companies with stable growth.
  • 20 to 30: The market rewards growth or quality. The pharmaceutical sector, consumer goods with strong brands, and industries with pricing power.
  • Over 30: Growth is already factored into the price. If it fails to materialise, the share price falls, but not the P/E ratio.

Typical ranges by sector, approximate figures over a cycle:

BranchTypical P/E ratioWhy
Banks, insurance companies8 to 14Cyclical, regulated, profits fluctuate
Utilities, telecoms10 to 16Stable, but with little growth
Industry14 to 22Cyclical, moderate growth
Pharmaceuticals, Health15 to 25Stable demand, patent risk
Branded consumer goods18 to 26Predictable profits, pricing power
Software, Tech25 to 40 and overStrong growth already factored in

The second comparison is with the company’s own history. A P/E ratio of 17 for Nestlé sounds normal. Compared to the 10-year average of around 22, it is low. Either the share is undervalued, or the market no longer believes in its former growth. The P/E ratio poses the question; you must answer it yourself.

P/E ratios for Swiss shares: SMI, Nestlé, Roche, Swiss Re

In spring 2026, the SMI is trading at a P/E ratio of around 19 to 20. The historical average stands at 15 to 16. Swiss shares are therefore valued above their long-term average, but the SMI is also a special index: Nestlé, Roche and Novartis account for almost half of its composition, and all three are high-quality companies with traditionally high P/E ratios.

TitleKGVBasic
SMI (index)around 19 to 20April 2026, historical period 15 to 16
Nestléaround 17Adjusted profit, September 2026
Rochearound 20reported profit, September 2026
Swiss Rearound 10.52026 forecast, lowest P/E ratio in the SMI

Swiss Re has the lowest P/E ratio in the SMI. Is it a bargain? Not necessarily. Reinsurers’ profits fluctuate with every natural disaster, and the market pays less for volatile profits. A P/E ratio of 10.5 is normal for the sector, not cheap. Roche’s ratio of 20 is also normal for the pharmaceutical sector. Comparing Swiss Re with Roche is a classic mistake: two sectors, one yardstick.

Figures as at September 2026; sources are listed at the end of the article. The figures change daily, but the classification remains the same.

Where can you find the P/E ratio?

You rarely have to work it out yourself. Four sources that work for Swiss shares:

  • SIX Swiss Exchange: On six-group.com, under «Key Figures» for each share. Official stock market data, free of charge.
  • finanzen.ch or cash.ch: Trailing P/E ratios and estimates are shown as «2026e» and «2027e». Pay attention to the basis.
  • Your broker: Swissquote, Saxo and most banks display the P/E ratio in the stock view, often alongside a sector comparison.
  • Annual Report: Earnings per share are shown in the profit and loss account. Just look it up, and that’s it. It’s the only way you can be sure exactly how much profit is in there.

If two sources show different P/E ratios for the same share, neither is wrong. They are based on different profit figures. That is why the calculator above asks you which profit figure you are entering.

Optimizations in the P/E ratio calculation

Four adjustments that make the P/E ratio more meaningful:

  1. PEG rather than P/E ratio for growth stocks. The P/E ratio divided by the expected earnings growth as a percentage. A P/E ratio of 30 with 30 per cent % growth gives a PEG of 1.0, which is considered fair. A P/E ratio of 30 with 5 per cent % growth gives a PEG of 6, which is expensive. The calculator above has a built-in PEG mode.
  2. Shiller P/E ratios for entire markets. Share price divided by the inflation-adjusted average earnings over the last ten years. Smooths out cycles. Rarely useful for individual shares, but the better tool for answering the question «Is the market expensive?».
  3. Average price rather than daily price. A 3-month moving average removes the element of chance associated with a specific reference date.
  4. Safety margin. If you’re not convinced by the profit, factor in 80 % of it. The P/E ratio will rise, and you’ll be able to see whether the share is still a reasonable investment even then.

Our financial tips for 2026

"Intelligent people learn from the mistakes of others".

We have compiled our top selection for you from all our tests and experience reports:

Limitations of the P/E ratio

Negative P/E ratio: If the company is making a loss, the P/E ratio is negative or not reported at all. The ratio is then meaningless. For start-ups and companies undergoing a turnaround, you should use revenue or book value ratios.

One-off effects: If a company sells a division, profits surge and the P/E ratio falls to 6. Next year, this effect disappears and the P/E ratio stands at 18. That is why we use adjusted profit.

Debts are missing: Two companies with the same P/E ratio: one is debt-free, the other heavily in debt. The P/E ratio does not distinguish between them. The price-to-book ratio (P/B ratio) and the equity ratio provide further insight.

Interest rate level: When interest rates rise, P/E ratios fall because bonds become a more attractive alternative. A P/E ratio of 20 was normal in 2021 but will be ambitious in 2026. When making comparisons across different years, bear interest rates in mind.

Conclusion on the KGV Meaning

The price-to-earnings ratio is the quickest indicator on the stock market – and the one most frequently misused. It tells you how much you pay for one franc of profit. It does not tell you whether that is a good price. That depends on the sector, the level of interest rates and whether the profit will still be there tomorrow.

Use the P/E ratio to sort stocks: same sector, same earnings base, then compare. And always look at the inverse. A 5.9 % earnings yield on Nestlé versus 4 % on a bond is a decision you can make. «P/E ratio of 17» on its own isn’t one.

If you want to value individual shares, you need more than just one key figure. For those who don’t want to do that, a broadly diversified ETF is the more sensible option.

Sources:
Tages-Anzeiger, SMI P/E ratio: How expensive are Swiss shares at present? (April 2026)
finanzen.ch, Roche share key figures (September 2026)
aktienfinder.net, Nestlé shares, adjusted P/E ratio (September 2026)
finanzen.ch, SMI report with FactSet estimate for Swiss Re (29 September 2026)

FAQ

There is no single figure that applies to all sectors. As a rough guide: 10 to 20 is normal; below 10 is cheap or a warning sign; above 25 means you’re paying for growth. Only make comparisons within a single sector and against the share’s own historical performance.

How many years’ profits you are paying for a share. A P/E ratio of 15 means that, assuming profits remain constant, it will take the company 15 years to earn back your purchase price. The reciprocal of this is the dividend yield, which is around 6.7 % for a P/E ratio of 15.

Not necessarily. A low P/E ratio may mean that the share is undervalued, or that the market expects profits to fall. Banks and insurers tend to have structurally low P/E ratios because their profits fluctuate.

In spring 2026, the figure will be around 19 to 20, compared with a historical average of 15 to 16. Swiss shares are therefore trading above their long-term average.

The PEG ratio is calculated by dividing the P/E ratio by the expected earnings growth. It indicates whether a high P/E ratio is justified by growth. A PEG ratio of around 1 is considered fair, whilst a figure significantly higher than this is considered expensive.

Write a comment

Your e-mail address will not be published. Required fields are marked with * marked.

Get your free
Investment Guidebook
receive!